In this article, I will discuss ways of finding value in football matches for betting and trading.
The aim of this series of videos is to look at different ways in which we can find value and I’m not using the word “value” flippantly.
In this article, I discuss Poisson and other calculators that I have created. If you don’t know what a Poisson calculator is, don’t worry. It’s easy. It’s just based on goals scored and conceded. I’ll also be talking about other methods of looking for value at football as well.
A. The Poisson Distribution for Predicting Goals is Supported by Academic Literature
There are several positive academic reports about the Poisson model for predicting football results.
So, Dixon and Coles is probably the most cited paper in relation to using the Poisson Distribution to predict football odds. They write that they used Poisson and it had a positive return when used as the basis of a betting strategy.
Our betting strategy is equally simple: we bet on all outcomes for which the ratio of model to bookmakers’ probabilities exceeds a specified level. For sufficiently high levels, we have shown that this strategy yields a positive expected return, even allowing for the in-built bias in the bookmakers’ odds
“Our betting strategy is equally simple: we bet on all outcomes for which the ratio of model to bookmakers’ probabilities exceeds a specified level. For sufficiently high levels, we have shown that this strategy yields a positive expected return, even allowing for the in-built bias in the bookmakers’ odds”.
Dixon, M.J. and Coles, S.G. (1997), Journal of the Royal Statistical Society: Series C (Applied Statistics), 46: 265-280. https://doi.org/10.1111/1467-9876.00065
“The goals scored by teams in soccer were found to follow Poisson distributions……A value betting strategy was devised and was noted to be profitable in the longrun”.
Mwembe, D. (2015). American Journal of Theoretical and Applied Statistics. 4. 99. 10.11648/j.ajtas.20150403.15.
We show that our statistical modeling framework can produce a significant positive return over the bookmaker’s odds”.
Koopman, S.J & Lit, R. (2012). Journal of the Royal Statistical Society: Series A (Statistics in Society). 178. 10.2139/ssrn.2154792.
Dixon and Coles (1997) and Koopman and Lit (2012) examined the English Premier League, while Mwembe studied Poisson in relation to the Zimbabwean League.
All 3 studies concluded that goals scored follow a Poisson distribution and reported that their betting strategy was profitable in the long term.
Therefore, the concept of using the Poisson distribution for predicting football results is widely documented in peer-reviewed journals. This means that this is real and it is a good starting point in our search for value.
These authors used Poisson as a one variable model and made a profit. They didn’t look at team sheets or anything like that. We are not going to use Poisson as a one variable model. If we keep refining our methods, we can keep improving our results.
I will cover the following topics in this article.
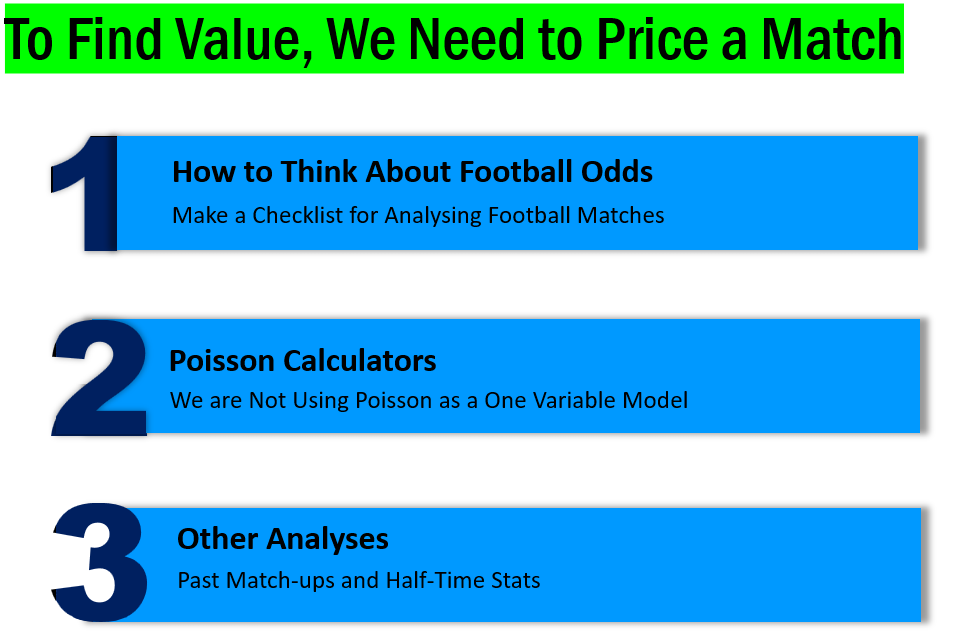
The first topic described a thinking process that we can use when analysing football.
The second topic is Poisson calculators. If you’ve already heard about Poisson calculators, my calculators have a lot more functionality compared to others that you might have seen. I won’t be going into the maths behind Poisson calculations. If you are interested, there is an article on my football calculator website explaining the calculations behind Poisson. The link is in the description.
Thirdly, I will discuss other ways of analysing odds. All of the ways of looking at odds, that I’m going to talk about, are important and valid.,
So, let’s get started.
B. How to Think about Football Odds
So, I will discuss how we should think about football odds. To do that, I will start by talk about when and how we should use stats.
Sports statistics should not be used blindly. We should always ask whether a statistic is giving us the answer that we are looking for. Even if it is, we should ask ourselves, how strong that statistic is.
In fact, statistics, on any subject should be questioned.
1. Avoid Using Statistics on Teams Going Through Change
In sports, there are often sample size issues, which can’t be avoided. In addition, there are often questions as to whether past results represent the current situation. The mistake a lot of people make is looking at a statistic, without questioning how well the data, behind the statistic, represents the current teams.
a) When Teams Sell their Good Players
For example, if a team sells all its good players, the team stats immediately after the sell-off are not going to represent the team’s ability at all.
An example of this was Monaco, who were a strong Champions League side a few years ago. Then, they sold all their good players, including Kyllian Mbappe. After the sell-off, Monaco’s results took an immediate downturn and the team has never been as good since.
b) When Teams Come into Big Money
The opposite side of this, is a team that comes into money and buys some good players. An example of this was Man City when it was taken over by the Abu Dhabi group in 2008. Such teams don’t necessarily show sudden and immediate improvement, as it takes time to build a new team. However, they will gradually but quickly improve over the following years. In this case, a past statistic is not going reflect the ability of a team, while it is climbing to a new level.
There’s nothing wrong with betting on Monaco or Man City now, as they have both settled down at their new level of play.
c) Underachieving Teams and Managerial Changes
Another type of team, in which statistics can be unreliable, are teams that have been underachieving and have changed manager. This isn’t as extreme as the other 2 examples. However, Man U have got a new manager and they have been underperforming. Therefore, it is probably best to just watch them for a while.
2. Statistics are Most Reliable when You are Looking at CONSISTENT Teams
The types of teams that statistics are most useful for are consistent teams. The team can be consistently good, consistently mediocre or consistently bad. If a team is consistent, the stats are more likely to represent the team’s future performance, compared to stats for an inconsistent team.
The point is, when using statistics, you always need to be connected to the data. You don’t need to look at the raw data but you do need to know the time period that the stats have come from and you also need, at least, a small amount of knowledge about a team.
C. Weighing Up the Evidence
We need to think of ourselves as detectives, looking for evidence. When a detective examines a crime, he probably starts with a checklist. This might include getting alibis, witness statements, and a range of forensic variables.
Often the detective will just have circumstantial evidence and people can be convicted based on circumstantial evidence if there’s enough of it.
In trading or betting, we can view looking at a football stats as analogous to circumstantial evidence. This is because statistical evidence has similar strength to circumstantial evidence.
So, a punter’s checklist might look something like this.
The evidence shouldn’t be evaluated as individual pieces of information but rather all together. Although we might collect the evidence bit by bit, we want all the evidence together to support or tell the same story. In court, if the circumstantial evidence doesn’t add up, the accused is not guilty. In sports, if the evidence doesn’t add up, the conclusion should be no bet and no trade.
Note that the detective and the courts don’t end up with a single number, whereby they can decide whether a suspect is guilty. They weigh up the evidence and make a judgement.
This is basically how we can analyse a football match.
In trading or betting, we can analyse a football match in different ways. We are not looking for a single number. Just like the detective, analysing a football match is about weighing up evidence.
Firstly, we can look at long-term data. There is more than one way of looking at long term data. I will explain these in this article.
Secondly, we can look at the short-term, such as recent matches.
Thirdly, we can look at the team sheets.
Fourthly, we need to learn about the market.
This will all be covered in this series of videos.
So, let’s start with the long-term view.
If you don’t really understand what I mean by a long-term and short-term view, it will become clear in a second.
D. Step 1: Use Transfermarkt to Assess the Market Value of Teams
I usually start my analysis by looking at a website called Transfermarkt.
This is a list of Premier League Teams, based on the total market value of each team’s players. You will find a similar list on this website for other leagues.
Why is this important?
This is the first way of getting a long term view on a team’s performance.
If you look at the list of teams, you may notice that team rankings (based on market value of the players) correspond quite strongly with teams’ finishing positions in the league. The top 6, in terms of market value, often finish in the top 6 in the league.
This correlation falls apart a bit in the lower half of the league. However, there their market value.
Earlier, I mentioned Man United’s finishing 7th last season as an underachievement. They were higher on this list during last season. I think that they were 3rd or 4th. That’s why 7th place was an underachievement.
At the bottom of the table, you’ll see the newly promoted teams, Fulham, Bournemouth and Notts Forest. Notts Forest have been out of the Premier League for 23 years. However, Fulham and Bournemouth have been in the Premier League in recent years.
They are the poorest clubs in the Premier League. However, if you look at the Championship, you’ll see that they would have been the wealthiest clubs in this league, had they stayed. In addition, 2 of the teams relegated from the Premier League (Norwich and Watford), at the end of 2021/22 season, were 2 of the poorest clubs in the Premier League, but they are now 2 of the wealthiest clubs in the Championship. Burnley would have been in third place. However, they have dropped down because they have sold 2 of their more valuable players this summer.
So, the teams that regularly go back and forth between the Premier League and the Championship, tend to be the poorest clubs in the Premier League, while being among the wealthiest clubs in the Championship.
So, the bottom line here is that you can get an idea on the positions that teams should theoretically end up in the league by looking at the Transfermarkt tables.
In addition, you can get an idea of which team will be favourite in a match, just by looking at the market values. In addition, this idea holds for international matches. The more money a team has, in terms of legs on the pitch, the more likely the team is to be favourite.
Of course, there are other influencing factors, such as home advantage and recent form.
So, this is a model of how I view football leagues.
The idea is that the squares represent a team’s probability of winning the league, based on their market value. Then, the other influencing factors, such as recent form, injuries and sacked managers, will influence the probability of a team doing better or worse than expected.
We can show this variation by these lines.
The lines are limited in how far above and below the money level that they go. This is because there are limits to how well or badly a team can do, based on their market value. For example, it’s almost impossible for Liverpool or Man City to end up in the bottom half of the table with the money that they have. Similarly, it would be a big achievement if Nottingham Forest ended up in the top half.
So far, we have an idea what a team’s odds should be relative to another team. Now, let’s look at some ways in which we can get a more precise idea of what the odds should be.
Let’s start with Poisson.
E. The Poisson Model
As I mentioned earlier, the Poisson model is based on goals scored and conceded over a long time period.
The Poisson model has mainly been reported to work for teams within the same league. Therefore, strictly speaking, the model shouldn’t be used for cup matches, even if the cup tie is between 2 teams from the same league.
So, this is one of my Poisson calculators.
I’ll use the Poisson calculator to analyse a fictitious match. I will put Brighton in as the home team and Liverpool in as the away team. When I put the second team name in, you will see some tabs appear at the top. These will have results for our short-term analysis. I will talk about that in the next video. I’m just pointing that out so that you know that you don’t need to go very far to do the short-term analysis.
So, this box allows you to choose how much data that you want to use for your analysis. I will use 5 years’ worth of data. The data is home data for Brighton and away data for Liverpool. Therefore, Brighton’s away record is not factored into any calculation. Similarly, Liverpool’s home record isn’t factored into any calculation. So, home and away is always used separately.
I don’t always use 5 years. Sometimes, I use less and occasionally, I use more. However, I always have a reason for my choice of the number of years. The main team characteristic that you want to see is a reasonable level of consistency over the years.
In general, it is better to use more data rather than less because this dilutes the effects of the occasional crazy result or crazy parlays. For example, Liverpool lost 6 home games in a row in the 2020/21 season. This is not likely to occur very often. Therefore, when you use a lot of data, the unusual parlays get diluted.
There are 2 types of teams that you don’t want to put into the analysis. The first type include teams that have come into a lot of money and have spent a significant amount on players, thereby climbing significantly in market value. The second type are teams that have lost a lot of market value and sold a lot of players. This doesn’t happen often. However, in both of these cases, the team, that you are analysing isn’t the same team that it has been over the past years. Therefore, I wouldn’t get involved with such teams.
This is an example of what I mean by when I say that it is important to understand how data influences your statistics.
So, as you can see, the Poisson calculator generates odds. If we scroll down to the bottom, you can see the Poisson distribution graph. So, you’ve probably heard of a normal distribution.
The Poisson distribution is another type of distribution. The main characteristic of a Poisson distribution graph is that it is heavily skewed to one side. Because it is a distribution, you need a lot of data.
You can also see the average goals scored and conceded by each team over 5 years for Brighton at home and Liverpool away. The mean is what we usually call the average. So, its all the goals added up and divided by the number of matches. I will talk about medians in a future video.
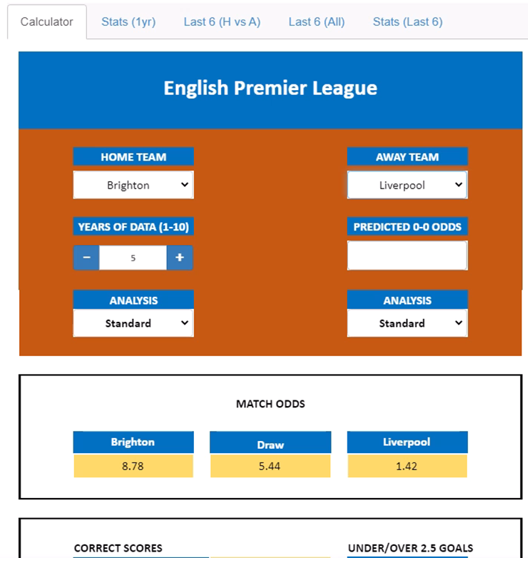
Let’s look at the match odds. Liverpool have odds of 1.42 to win. Although the research suggests that we can trust these odds for a bet, we want to be more targeted.
We need to consider that there are 2 separate questions regarding the odds.
Firstly, can we trust the 1.42 for a pre-match trade? In other words, if we see that Liverpool’s odds are higher, such as 1.55 at Betfair, can we back Liverpool, with the belief that the odds will come down to 1.42 pre-match?
Secondly, can we bet on the outcome of the match or get involved in an in-play trade? What I want to remind you of, is that all of the research papers on Poisson and football results, that I presented earlier, were about betting on the match result. They weren’t about pre-match trading. I don’t think that there is any difference between in-play trading and betting. However, there is a big difference between the pre-match and in-play markets.
Therefore, we need to consider the 2 types of trades separately.
F. Other Analyses
So, now we have gained information about odds from the Poisson calculator, we will look at other ways of analysing odds.
So, we are going to use 2 more analyses. Firstly, we will look at the odds for this match when the 2 teams have met before and secondly, we will look at half-time data.
You can see that there are a bunch of links in the sidebar. The one named, ”Past 5 Years’ Odds” may help us with this analysis.
1. Past 5 Years Odds
So, I will click on the link and bring this up.
This opens in a new window. Therefore, you don’t lose the research that you’ve already done.
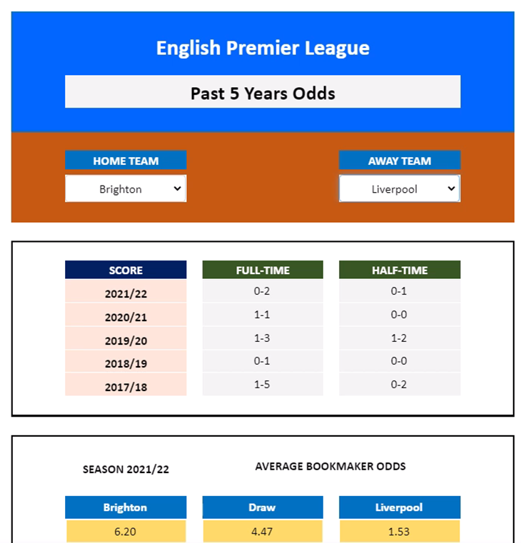
What you can do here is look up previous match-ups between Brighton and Liverpool and check what the half-time and full-time results were. More importantly, we can check what the average bookmakers’ odds were on these games.
Before we look at the results, we will look at the odds. Be aware that these are average bookmaker odds with an overround. Therefore, Betfair odds will have been higher.
So, let’s deal with pre-match first.
So, just looking at these odds, if the odds are above 1.5, there isn’t any reason for us to expect the pre-match odds to drop down to 1.42. The past odds are all above 1.42, apart from the 2018/19 season. I tend to ignore the 2020/21 season because of the disruption to sports and life in general.
There may be an angle for pre-match trading. However, I will cover this idea in a future video. I know I keep saying that I’ll cover stuff in future videos, but explaining pre-match trading here would take time and take me too far off topic.
So, for now, we’ll talk about in-play.
If Liverpool’s odds are over 1.5, in-play looks good. Liverpool have won this tie 4 out of 5 times in over the past 5 years. In addition, the season that they failed to win was the 2020/21, which is the season, in which I don’t particularly trust the stats. Goals have been scored in every game in the past 5 years.
Although this is a small sample, it’s important to be aware that I am not reaching conclusions from these results alone. I am using these results to support or deny the Poisson calculator results. The results and the Poisson calculations, combined, suggest that Liverpool would be value at odds of 1.5 and above, which were offered in previous years.
2. Half-Time Odds
The next question is, whether there might be a half-time angle?
Looking at the results, there have been 2 nil-nils at half-time. However, a goal has been scored in every game in the second half.
That points towards betting on a goal at half-time.
The evidence is building up.
Can we refine this further? Yes, we can.
Let’s look at past half-time results of both clubs.
So, now I would look at past half-time stats. So, I would click on the link “Half-time Stats” in the sidebar.
So, you can put 4 half-time scores into the calculator. I’ll put 0-0 in. You’ll immediately see the league averages appear at the bottom. So, the league average for a goal after half-time, from the perspective of the home side, is 77.28% and the league average for away sides is 75.29%.
If you are wondering why there is a difference between number of home and away matches, it is because I haven’t included data for teams that have been relegated from the Premier League.
The percentages on this calculator answer the question, “was a goal scored in the second half?” It doesn’t tell us which team scored in the second half. It just tells us whether the second half was goalless or not.
So, unlike the other data, these data are not interactive. In other words, when we put team names in, the statistics are independent from each other. So, I can input Brighton and you’ll see a list of statistics appear. So, these statistics reflect Brighton’s home games, when the score was 0-0 at half-time, against any other team.
The data in this calculator goes back 10 years. This might seem like we are looking too far back in time. However, when you look at the sample sizes, you can see that they would be less than a handful of games, if we looked at 1 year’s worth of data. Therefore, we have to do the best we can with the data that we have. However, we shouldn’t ignore the fact that, if a team has been inconsistent or has changed significantly in market value over the past 10 years, we might not be able to work with these results.
Brighton have been in the Premier League, since the 2016/17 season. Therefore, we are only looking at 5 year’s worth of Brighton data. Although Brighton’s 2021/22 season, that was better than usual, I would say that both clubs have been reasonably consistent over the time period that we are looking at.
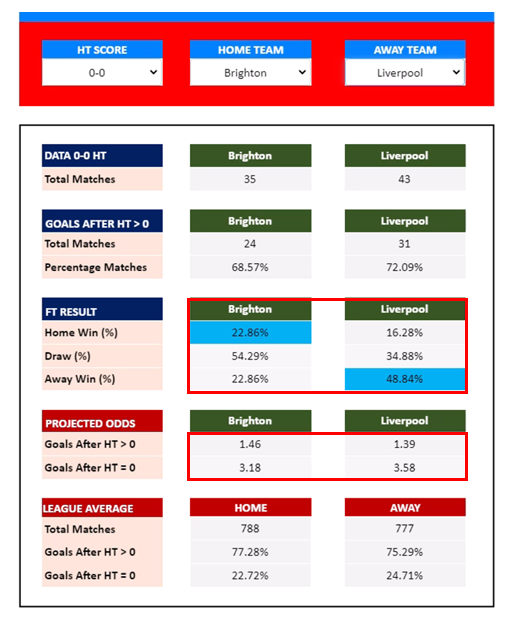
You can see that, historically, when Brighton have been at 0-0 at half-time, a goal has been scored in the second half just 68.57% of the time. Although this is way below the league average of 77.28%, it’s the odds that matter.
So, now, I’ll input Liverpool on the away side. Remember, these results are independent of Brighton’s results.
You’ll see here the projected odds. These are based on the historical statistics. The Goals After HT > 0 odds are the odds that you would be looking at if you wanted to get involved on the over 0.5 goals market. The Goals After HT = 0 are the odds that you would be looking at if you wanted to get involved in the under 0.5 goals market or the correct score nil-nil market.
The projected odds for Liverpool will be different from Brighton. Ideally, you would want to beat the least favourable odds.
For example, if you wanted to bet on a goal in the second half, you would want odds better than the higher odds of 1.46, rather than 1.39, although if there is a big difference between the odds, you might get value at some point between the odds.
In either case, I would want to make sure you are getting decent odds to get involved. You don’t want to go for thin value bets or trades.
In addition, you want to combine this information with the previous information that we have obtained. In this case, the previous information is that, in the last 5 meetings between Brighton at home and Liverpool away, there has been a goal in the second half.
I’ve also provided the percentages for the match odds markets for both teams. This is because you might find value on the match odds market.
What about other half-time score-lines? A lot of people think about betting on a goal at 0-0 but not at 1-0 or 0-1. If we change the half-time score to 1-0, you’ll see that the percent chance of a second half goal increases above 80% for both teams. The league average also increases compared to when the half-time score is 0-0.
If we change the half-time score to 0-1, you can see that, historically, there has been at least one second half goal in 90% of Brighton’s matches.
The thought process about odds is similar to the thought process that I described for 0-0. However, there is one difference worth pointing out. That’s is, there is a big difference between the 2 team’s projected odds. In the 0-0 example, I said that you need to beat the least favourable odds to potentially find value. In that situation, the projected odds between the 2 teams were close together.
However, when the projected odds are far apart, it might be possible to find value at odds between Brighton and Liverpool’s these odds. So, you don’t necessarily need to beat the least favourable projected odds.
G. Conclusions
So, I’ve explained that to use statistics in sports, we should combine them. In addition, we should be aware of how the data behind any statistic affects the statistic’s reliability.
Slide
If you want to find out how to get access to my calculators, check the sidebar on my Exploitative Betting website. The link is under the video.
I haven’t spoken about team sheets and how to factor that in yet. However, remember that the stats (including those given by the Poisson calculator) do not take team sheets into consideration. The stats are based on teams, with an average number of injured players throughout a season. The stats are not based on teams that are permanently at full strength.
So, the next video, I have planned is looking at the short-term analysis ie the last 6 matches.
That’s all for this video. Take care and good luck.
